Analysis: China Steel Exports January-June 2017 down 28%
05 08 17 18:20
In general, this reduction can be attributed to anti-dumping and anti-subsidy measures of destination countries, but not exclusively. Availability and price played an important role, too.
In spite of the much lower export quantity, the value of Chinese steel exports in H1 2017 climbed 4.7% year on year to US$ 28 billion, because of price increases.
The jump in NAFTA imports was driven by Canada, 462,000 tons, a plus of 55% year on year.
In spite of the much lower export quantity, the value of Chinese steel exports in H1 2017 climbed 4.7% year on year to US$ 28 billion, because of price increases.
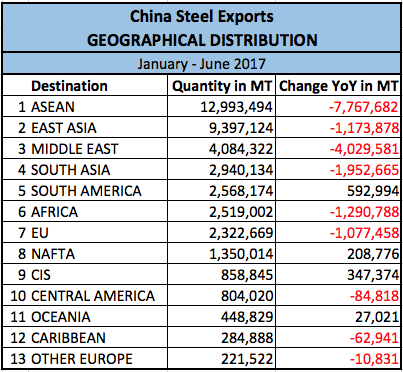
China steel exports by area
Quantities in metric tons
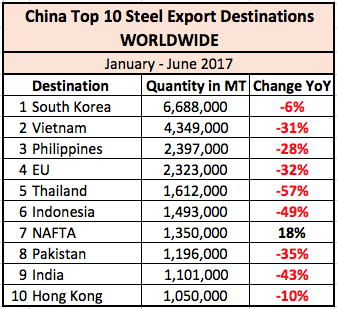
The top 10 destinations represent 57% of China's total steel exports
South Korea and Vietnam still the most important export markets
The jump in NAFTA imports was driven by Canada, 462,000 tons, a plus of 55% year on year.
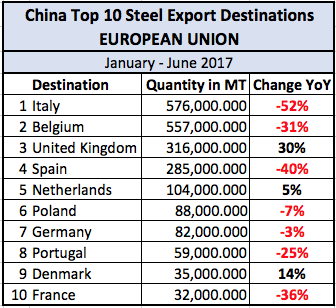
China's top 10 steel destinations within the EU
Showing an unusual jump in steel exports to the UK
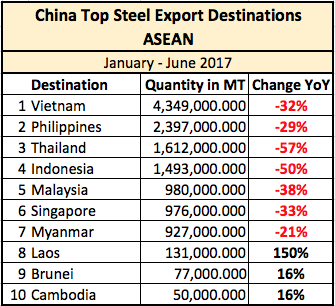
Down 37%, still ASEAN remains China's largest steel export region
But also here a big drop from 20.8 million tons during first half 2016 to 13 million tons during the first half of 2017.
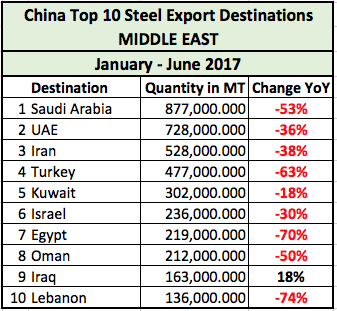
China's steel exports to Middle East drop nearly 50%
Exports to Middle East were 4.1 million tons in H1 2017, after 8.1 million tons in first half 2016.
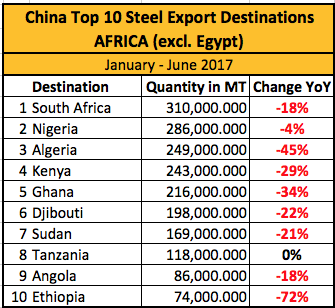
Steel export results to Africa down by a third.
Not much better the export results to Africa. Steel exports from China to Africa in H1 2017 slipped 1/3 to 2.5 million tons.
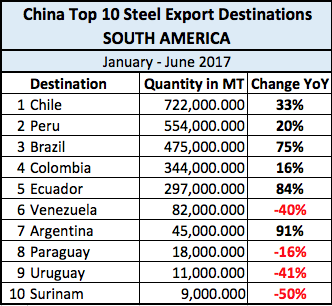
South America bucks the trend!
Exports to South America, however, showed a 30% increase of China steel exports, reaching 2.6 million tons in H1 2017.
Also exports to the CIS are up
China's steel export to the CIS was 860,000 tons, an increase of 68% over the same period 2016. The main reasons were a doubling of exports to Russia and big increases to Uzbekistan (+65%) and Kazakhstan (+44%).How does all of this look from a product perspective?
The main China steel export quantity differences in H1 2017 compared to H1 2016 are:- Steel bars, down 12 million tons (-67%)
- Wire rods, down 2.1 million tons (-36%)
- Medium plate, down 1 million tons (-27%)
- Sections, down 0.84 million tons (-35%)
- Color coated flats, down 0.64 million tons (-18%)
- Cold rolled strips up 0.5 million tons (+39%)
- Plated/galvanized sheets up 0.28 million tons (+4.8%)
- Hot-rolled narrow strips up up 0.2 million tons (+161%)


